Introduction
Modern networks don’t sit still. They span hybrid clouds, SD-WAN edges, Wi‑Fi, SaaS, and mission‑critical apps your customers touch every minute. When something blips, users feel it fast. That’s why real-time network analytics has gone from “nice to have” to must-have for IT managers and CTOs. The goal isn’t just more data; it’s faster, clearer decisions that protect experience, revenue, and reputation.
Below is a practical implementation guide to deploy real-time analytics that improves network performance, shrinks MTTR, and gives leadership the visibility they expect.
What are real-time network analytics?
Real-time network analytics is the continuous collection, correlation, and analysis of network telemetry flows, packets, logs, synthetic tests, and streaming metrics to detect, explain, and predict issues as they occur. When implemented correctly, it helps you:
- Correlates network monitoring signals (latency, jitter, loss, throughput) with application KPIs.
- Surfaces root cause and impact by user, site, path, and service.
- Feeds intelligent alerts, SLO dashboards, and automated remediation.
Key benefits for IT leaders
- Lower MTTR & fewer escalations. Troubleshoot by path (user → site → WAN → SaaS) and fix the right thing first.
- Better user experience. Catch spikes in latency, jitter, and packet loss before they become tickets.
- Clear executive visibility. Roll up noisy metrics into a business‑level reliability score for concise reporting.
- Capacity & cost control. Use trend analysis to right‑size circuits, clouds, and caching.
- Security & resilience. Baselines and anomalies help flag risky changes and degradations quickly.
Cut MTTR, boost reliability, and prove ROI with real-time network analytics.
How real-time network analytics works
- Data sources: streaming telemetry (SNMP replacements), flow/IPFIX/NetFlow, packet taps, device logs, cloud provider metrics, and synthetic monitoring.
- Collection & transport: lightweight agents or collectors ship telemetry to a central pipeline.
- Analytics engine: correlation, baselining, anomaly detection, path mapping, forecasting.
- Visualization & alerting: role‑based dashboards, SLOs, and alerts integrated with ITSM/ChatOps.
- Automation: runbooks and policy triggers drive remediation and escalation.
Real-Time Network Analytics: Step-by-Step Implementation Guide
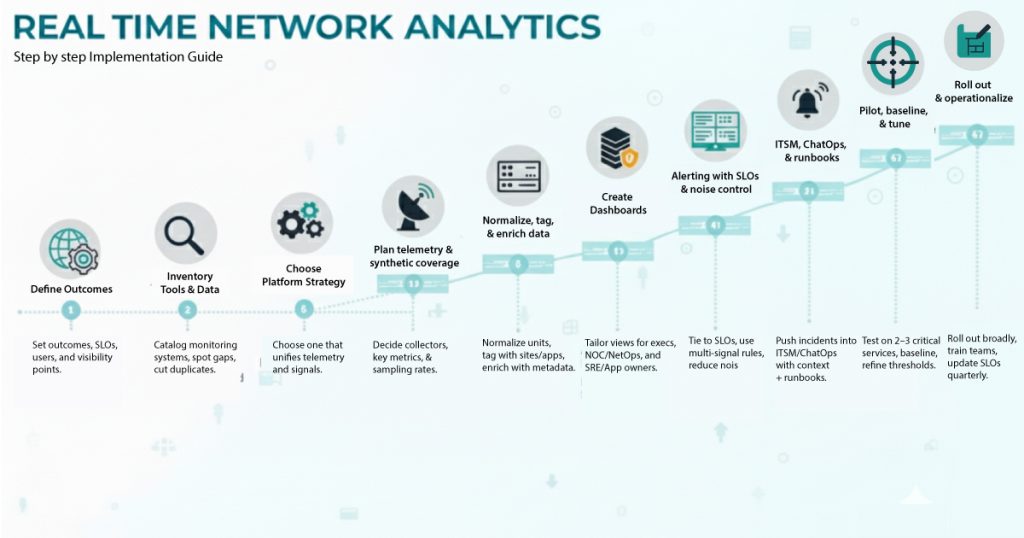
1) Define outcomes, SLOs, and scope
Start with business outcomes. Which services matter most? What SLOs (e.g., <150 ms round‑trip latency for SaaS X) map to those services? Define who uses the data (NOC, NetOps, SRE, Security) and where you need visibility (branches, data centers, cloud VPCs).
2) Inventory current tools and data
Catalog existing network monitoring and observability tools (flow collectors, packet analyzers, cloud logs, APM, and Wi‑Fi controllers). Identify blind spots (e.g., SaaS paths, remote users, East‑West traffic) and duplicative tooling you can consolidate.
3) Choose your platform strategy
Select a platform that can correlate multi‑domain telemetry and present clear reliability signals for decision‑makers, not just dashboards for every metric. If you prefer a turnkey path-based approach with built‑in scoring, evaluate ScoutITAi Features and its Application Management to standardize onboarding, policy, and access.
4) Plan telemetry and synthetic coverage
Design a coverage map:
- Where to place collectors/agents (branches, hubs, cloud regions).
- What to collect: streaming metrics, flow (top talkers, conversations), packet samples, DNS/HTTP checks, and synthetic transactions to SaaS.
- How often to sample for “real time” (e.g., 15–60 s intervals) without overwhelming storage.
Leverage a curated set of signals (latency, jitter, loss, throughput, and error rate) and avoid collecting everything just because you can.
5) Normalize, tag, and enrich data
Standardize timestamps and units; tag records with site, user, device, ASN, application, and environment. Enrich with CMDB/asset metadata and business ownership so you can pivot quickly during triage and report by cost center or service.
6) Create dashboards
Audience-specific views:
- Executives: reliability score, SLOs, top risks.
- NOC/NetOps: health by site, path, and provider; alerts stream.
- SRE/App owners: dependency map, p95 latency, error budgets.
Use ScoutITAi’s Dashboards to keep views consistent across teams and to align engineering work to business reliability.
7) Alerting with SLOs and noise control
Alerts are tied to user impact and error budgets, not just static thresholds. Multi-signal conditions (e.g., latency and loss for three consecutive intervals) and auto-suppress flapping alerts. Route by ownership and severity.
8) ITSM, ChatOps, and runbooks
Incidents into ITSM with rich context (path, probable cause, last change). Runbooks and links to known-error records. If you need vendor/SaaS status correlation, wire in integrations so engineers can act in one place.
9) Pilot, baseline, and tune
30-45 day pilot on 2-3 critical services (e.g., UCaaS and a revenue-impacting SaaS). Baseline per site and time of day, then tune thresholds to minimize false positives while catching real degradations. Validate MTTR improves, and executives get clearer views.
10) Roll out and operationalize
Expand to remaining services. Document ownership, on-call rotations, and escalation policies. Train teams with structured Help Guides and publish runbooks for the top 10 incident patterns. Quarterly reviews to refresh SLOs and retire low-value alerts.
Best practices
- Focus on “golden” signals. Latency, traffic, errors, saturation, plus jitter/loss for voice and video.
- Mix passive and synthetic. Passive flow/packet analytics show reality; synthetic probes validate paths to critical SaaS (e.g., SSO, CRM, video). Correlate across layers. Wi-Fi, LAN, WAN, Internet, and SaaS telemetry; always ask, “Which hop or provider?”
- Measure what leaders understand. Raw metrics into a business-relevant reliability score for clear communication (e.g., RPI©).
- Automate triage. Auto-classify incidents (noise vs. real) and attach the next best action.
- Review post-incident. Update baselines, dashboards, and runbooks after every major outage.
- Anchor to standards. For governance and continuous monitoring strategy, NIST’s guidance is a good reference. See NIST SP 800-137.
Common Challenges & How to Fix Them
- Alert storms & fatigue. Over-thresholded tools create noise.
Fix: switch to SLO/event-driven alerts and multi-signal correlation. - Blind spots (SaaS, home users, ISP edges).
Fix: deploy synthetic monitoring from strategic locations and instrument remote endpoints. - Too many dashboards, not enough answers.
Fix: consolidate views and elevate to business-level reliability; tie incidents to user impact. - Data silos.
Fix: use a platform that ingests multi-domain telemetry and enriches it with business context. - Storage sprawl.
Fix: Keep high-res data for recent periods (e.g., 7-14 days) and roll up for long-term trends. - Change risk.
Fix: Correlate incidents with recent config, firmware, or route/policy changes. - “Real-time” cost tradeoffs.
Fix: right-size collection intervals and selectively packet-capture only where deep analysis is needed.
Conclusion
Implementing real-time network analytics isn’t just installing tools; it’s setting clear objectives and SLOs, choosing the right metrics, building role-based visualizations with SLO-driven alerts, and refining continuously.
ScoutITAi combines the RPI© Index, multi-location dashboards, and integrations to drive full-stack visibility and reliability. Expect better performance, fewer outages, and happier users.
Want to see how real-time analytics transforms network performance? Discover our Features and Case Studies, and book a demo today.
Frequently Asked Questions
Traditional network monitoring checks device and interface health at intervals and raises threshold alerts. Real-time network analytics correlates multi-source telemetry (flow, packets, logs, synthetics) to pinpoint user impact and root cause across paths so teams can fix the right thing faster.
Focus on latency, jitter, packet loss, throughput, and errors, plus saturation/utilization. For voice/video, jitter and loss dominate experience. For SaaS, DNS and HTTP timing, TLS setup, and path changes are key.
For most services, 15–60-second intervals are a good balance between speed and cost. Keep recent data at high resolution for rapid triage, then downsample for trend analysis. Critical sites or services can run tighter intervals during incidents.
Yes. Passive flow/packet data shows real user traffic, while synthetic monitoring tests known paths to SaaS and APIs on a schedule to catch issues even when traffic is low and reveal which hop/provider is failing.
Alert on SLO breaches and multi-signal conditions, not single thresholds. Add duration windows and deduplicate by path/provider. A reliability score like RPI© helps rank what to tackle first.
Run a 30-45 day pilot on two high-impact services. Baseline MTTR, ticket count, and SLA penalties, then compare. Use executive dashboards to show fewer escalations and faster recovery tied to business outcomes.
Apply tiered retention: hot, high-res storage for the last 1-2 weeks; aggregated rollups for quarters; and on-demand packet capture for deep dives. Tag data by service/site to archive intelligently.
Not a replacement for security tools, but baselines and anomaly detection can flag unusual flows, route changes, or policy drift. Correlation across layers helps triage when performance and security symptoms overlap.
Use continuous monitoring guidance from NIST SP 800-137 as a starting point and adapt to your environment for consistent policies and auditability. It complements your implementation guide for operations over time.
Map business-critical services and SLOs, then choose a platform that aggregates telemetry and produces usable reliability views. Check out ScoutITAi Features and Application Management to get up and running quickly.

Tony Davis
Director of Agentic Solutions & Compliance