Introduction
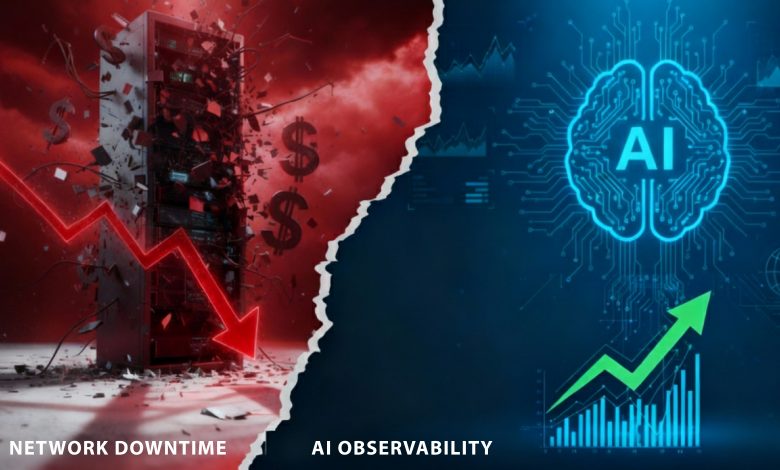
Downtime isn’t a glitch; it’s a balance-sheet event. Network outages compound into lost revenue, SLA penalties, reputational damage, and productivity drain. Recent research shows the average hour of downtime now tops $300,000 for most mid-to-large enterprises, with peak scenarios stretching into millions per hour.
In today’s hybrid, multi-cloud reality, tool sprawl and alert fatigue make it harder to see what’s failing and why before customers feel it. This 2025 report explains the costs, why legacy monitoring misses, and how ScoutITAi’s agentic AI turns noisy telemetry into clear, business-aligned actions. Protect revenue, reduce penalties, and accelerate recovery across every layer of your stack.
The Real Cost of Network Downtime in 2025 and How AI Stops It
Why downtime costs are increasing
There’s a clear counterintuitive trend in 2025: major outages are happening less often, but they’re far more expensive when they do. The reason is today’s sprawl of hybrid cloud architectures, third-party dependencies, and an ever-expanding web of SaaS and APIs, so a single failure ripples further and faster.
The cost spike is real: more than 90% of mid-to-large enterprises now estimate downtime at $300K or more per hour. Security incidents intensify the impact, with the average data breach costing about $4.88M in 2024 and operational disruption driving much of that total. And because networks frequently sit at the center of these chains of dependency, network issues remain a leading cause of IT service outages, so as dependencies multiply, the financial impact multiplies right along with them.
What the “cost of downtime” really means
| Cost Bucket | What It Looks Like | Who Feels It |
| Direct revenue loss | Abandoned carts, blocked transactions | Sales, Finance |
| SLA penalties | Contractual fines for missed uptime | Customer Success, Legal |
| Productivity loss | Support & engineering firefighting | Engineering, IT Ops |
| Reputational damage | Customer churn, PR fallout | Marketing, Executive |
| Security exposure | Breach and recovery costs | Security, Risk, Board |
Many of these costs compound during multi-hour incidents and in regulated industries (finance, healthcare).
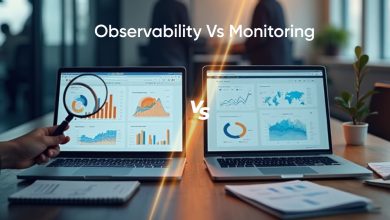
How AI observability changes the equation
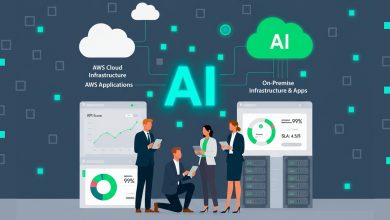
Modern AI observability platforms combine agentic AI, GenAI, and forecasting to turn complex telemetry into answers. This is the core of ScoutITAi’s Event Intelligence Service (EIS) for hybrid environments.
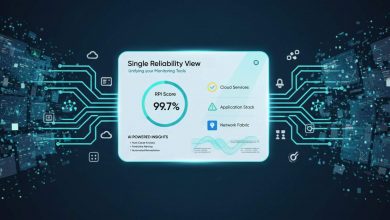
ScoutITAi at a glance- Reliability Path Index (RPI Score): Condenses thousands of signals into a single reliability score across 13 buckets understandable by IT and the business.
- Predictor (Monte Carlo Forecasting): “What-if” engine running up to 100k sims to show RPI impact and reliability ROI before you spend.
- Blender (Six Sigma Analysis): Cuts noise in real time by linking scattered alarms/metrics to the true drivers.
- Trender (KAMA): Tracks against a rolling 100-day baseline to catch slow, early degradation.
- Agentic AI Automation: Orchestrators and sub-agents triage, escalate, self-correct, and turn telemetry into plain-language steps.
- Universal Hybrid Monitoring: AWS, Azure, GCP, and on-prem with up to 12 months of performance visibility.
Downtime to business risk
AI has moved from accessory to engine. We’re moving from people RPI Score is designed to democratize observability so a VP of Network Operations and a CFO can have the same conversation:
- “Current RPI = 84/100 (stable). Top risk: East-US transit congestion; probable impact: 6–9% checkout failure during peak. Projected RPI with additional peering: 90–92.”
- “The MTTR trend improved 18% QoQ after noise reduction on alarm families X/Y; SLA penalty exposure was reduced by an estimated $1.2M.”
This is the shift from dashboards to decisions.
From reactive to predictive: what good looks like
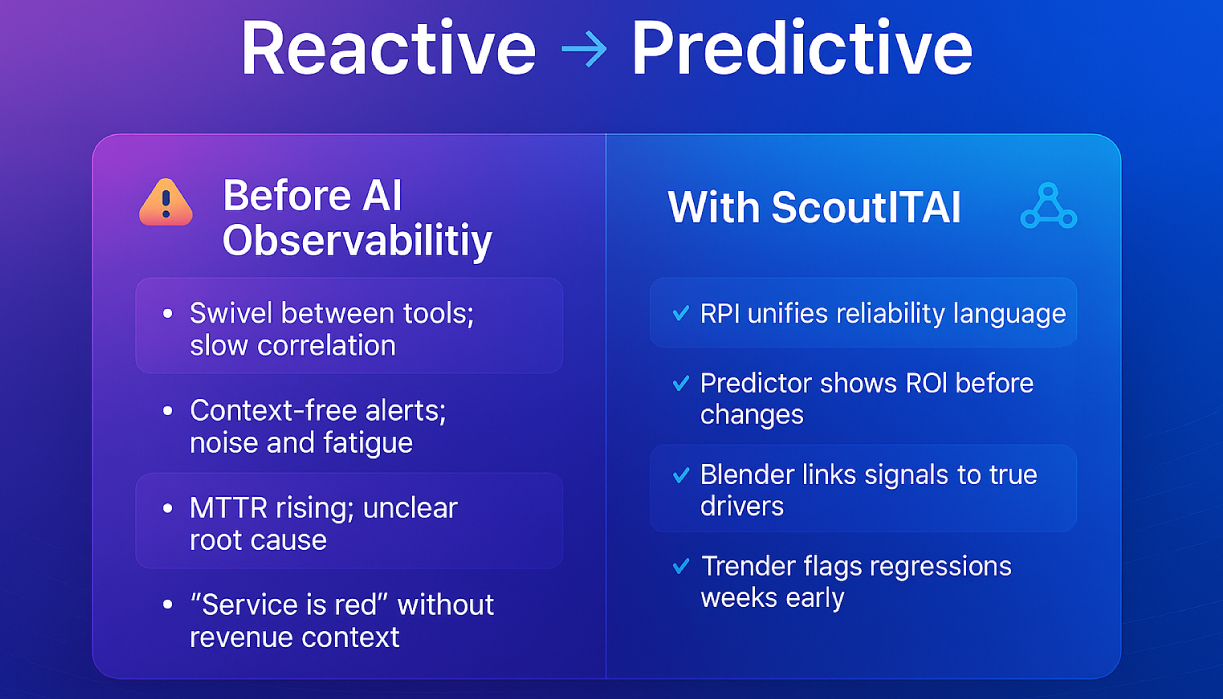
What to do in 2025
- Standardize on a reliability score (e.g., RPI) across the network, app, and infra to end tool-by-tool debates.
- Consolidate telemetry into an AI observability platform that speaks business outcomes.
- Use forecasting (Monte Carlo) to prioritize investments by projected reliability lift.
- Operationalize Six Sigma to reduce noise and alert fatigue.
- Automate the first mile of incident response (classification, correlation, suggested fixes) to compress MTTR.
- The report in business language ties changes to SLA exposure, conversion rates, and churn risk.
Conclusion
Downtime is now a board-level risk. 2025’s reality is clear: while severe outages may be less frequent, their financial impact grows, and the winners are those who predict and prevent. With agentic AI, Monte Carlo forecasting, Six Sigma-powered correlation, and a unified RPI score, ScoutITAi translates fragmented telemetry into clear guidance that safeguards revenue, customers, and your brand.
Ready to prevent downtime?
Book a demo or explore the platform and experience RPI, Predictor, Blender, and Trender.
Frequently Asked Questions
It varies by industry and size, but many mid-to-large enterprises estimate tens of thousands to hundreds of thousands per hour, with peak scenarios reaching into the millions.
It correlates signals across apps, networks, and infrastructure; translates them into plain-language insights; and automates triage—reducing MTTR and preventing repeat incidents.
RPI simplifies thousands of metrics into a single reliability score across 13 buckets, allowing IT and business leaders to communicate using a shared, business-relevant language.
Yes. Predictor runs Monte Carlo simulations to forecast how configuration or capacity changes could affect reliability—helping you prioritize fixes with the highest ROI.
Blender applies real-time Six Sigma analysis to cluster and deduplicate noisy alarms, surfacing only the alerts that truly matter—complete with clear root-cause context.
It measures adaptive moving averages against a 100-day rolling baseline to detect subtle performance degradations weeks before they escalate into major incidents.
Yes. ScoutITAi supports AWS, Azure, GCP, and on-prem environments—providing unified visibility for up to 12 months across hybrid and multi-cloud infrastructures.
ScoutITAi integrates seamlessly with popular observability tools like Splunk, Dynatrace, Broadcom, and AppNeta, ingesting telemetry for a reliability-centric view without requiring a rip-and-replace.
The Agentic Workforce Framework leverages orchestrators and sub-agents with strict guardrails, governance policies, and drift/hallucination controls to ensure actions remain safe, auditable, and compliant.
Most teams start with RPI scoring and alert noise reduction to stabilize operations, then layer forecasting and automation. Value typically appears through faster triage, lower MTTR, and clearer business reporting.

Tony Davis
Director of Agentic Solutions & Compliance