Introduction
IT operations teams are often overwhelmed by a multitude of tools and siloed data, leading to surprise outages and a lack of a single, unified view of reliability..
The solution lies in AI-based reliability forecasting and AI-powered observability. This approach moves beyond metric overload to provide a unified IT reliability score and forward-looking insights that are crucial for boosting uptime and digital experience reliability.
This article will explore how forecasting, agentic AI, and Scout-itAI’s event intelligence platform work together to enable proactive, data-driven reliability decisions, effectively replacing reactive firefighting.
The Reliability Paradox: Too Many Tools, Not Enough Insight
Most mid-to-large enterprises now run on hybrid cloud observability, or at least, they try to.
You’re monitoring:
- Mainframe and legacy systems
- Cloud-native apps spread across AWS, Azure and GCP
- SD-WAN and complex modern networks
- APIs, SaaS and third-party services
Each domain often has its own vendor, its own console and its own alert rules. The result?
- Too many monitoring tools with overlapping alerts
- Siloed metrics that can’t be easily correlated
- Endless alert storms and alert fatigue
- No easy way to standardize reliability across mainframe and cloud
You might know CPU is red in one region and packet loss is spiking on one circuit. But answering the CEO’s question “Are we getting more reliable?” is still hard.
What you really need is:
- A way to measure service reliability consistently
- A business-friendly observability layer that can translate IT metrics to business language
- Clear, trusted reliability reporting for CIOs and digital leaders
That’s where the Reliability Path Index comes in.
SGrab the RPI Executive Scorecard Template to simplify reliability reporting instantly
From Raw Metrics to a Single Reliability Path Index
What is a Reliability Path Index (RPI)?
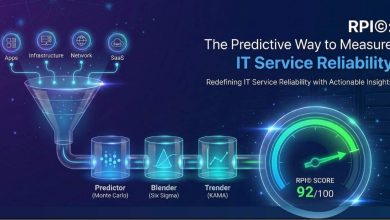
The Reliability Path Index (RPI) is Scout-itAI’s patented, 13-bucket scoring system that turns thousands of signals into one unified RPI score. Instead of bouncing between tools, you get a single, standardized view of how reliable a given path, service or journey really is.
Think of it as a modern answer to:- How to measure reliability across hybrid cloud
- How to create a reliability score for IT services
- How to unify logs, metrics and traces into one reliability score
Because RPI is built from 15+ years of industry data, it’s designed to be trusted by both:
- Technical leaders – IT operations managers, network engineers, NOC teams
- Business stakeholders – CIOs, CDOs, VPs of Digital, Directors of Marketing
With the Scout-itAI reliability path index, an event intelligence service sits above your existing tools, acting as a unified reliability dashboard that democratizes observability for everyone.
How AI-Based Reliability Forecasting Works
Once you can measure reliability with an RPI score, the next question is simple:
“How will reliability change if we ship this release, change this route or move this workload?”
This is where reliability forecasting for cloud services becomes powerful.
Monte Carlo Forecasting for IT Reliability
Scout-itAI’s Predictor uses Monte Carlo forecasting for IT reliability, running up to 100,000 simulations to estimate how changes could impact your RPI score
That means you can:- Model how to forecast reliability of cloud applications
- Quantify the reliability impact of new releases or migrations
- Use Monte Carlo simulation for IT planning to compare options
- Make predictive analytics for IT operations a daily habit
Instead of guessing whether a change might cause downtime, your teams finally get a quantified view of reliability ROI before they act.
For observability for CIOs and digital leaders, this is huge. It turns reliability into a planning input, not just a post-incident report.
Beyond Forecasting: AI Finds and Fixes Problems Faster
Forecasting is only part of the story. To really improve MTTR with AI, you also need help understanding what’s happening right now and why.
Six Sigma Analysis for Performance Monitoring Scout-itAI’s Blender applies Six Sigma for IT operations, using real-time statistical techniques to detect patterns across alarms and metrics. This Six Sigma analysis for performance monitoring helps:
- Correlate signals from different tools
- Separate meaningful patterns from random noise
- Highlight which reliability paths are truly at risk
This is especially valuable for reliability analytics for NOC teams and observability for IT operations leaders who live inside war rooms.
Adaptive Moving Average (KAMA) for Long-Term Trends
Short-term noise is one thing. Long-term drift is another.
Scout-itAI’s Trender uses Kaufman Adaptive Moving Average (KAMA) in IT to compare current performance against a rolling 100-day baseline. This adaptive moving average for performance trends makes it easier to:
- Spot slow degradation before it becomes an outage
- Understand what is KAMA in performance monitoring in practical terms
This is where network performance for digital leaders and app owners get continuous, context-rich visibility into how their domains are trending.
Agentic AI for IT Operations and Incident Management
All of this is orchestrated by an agentic AI for IT operations framework:
- Orchestrators and sub-agents continuously monitor RPI scores
- AI models correlate events across tools to drive noise reduction in observability
- Automated playbooks support AI automation for incident management
The outcome:
- Fewer meaningless alerts
- Faster root-cause isolation
- Clearer, plain-language explanations you can share with non-technical stakeholders
Instead of another chatbot, you get AI-powered observability that actively helps the team make better decisions.
Translating Reliability for Executives and Business Stakeholders
A significant challenge for IT leaders is articulating IT reliability to the CEO in a way that avoids technical jargon.
Because Scout-itAI turns telemetry into:
- RPI scores
- Trend lines
- Business-impact narratives
it becomes far easier to:
- Explain reliability to executives using consistent metrics
- Provide best practices for reliability reporting in enterprises
- Deliver reliability metrics for business stakeholders that actually mean something
This is business-friendly observability: not hiding complexity, but translating it.
Why Scout-itAI Is More Than Just Another Monitoring Tool
Scout-itAI isn’t replacing your entire monitoring stack. It’s a cloud-native observability layer and event intelligence platform on top of what you already have.
Key benefits:
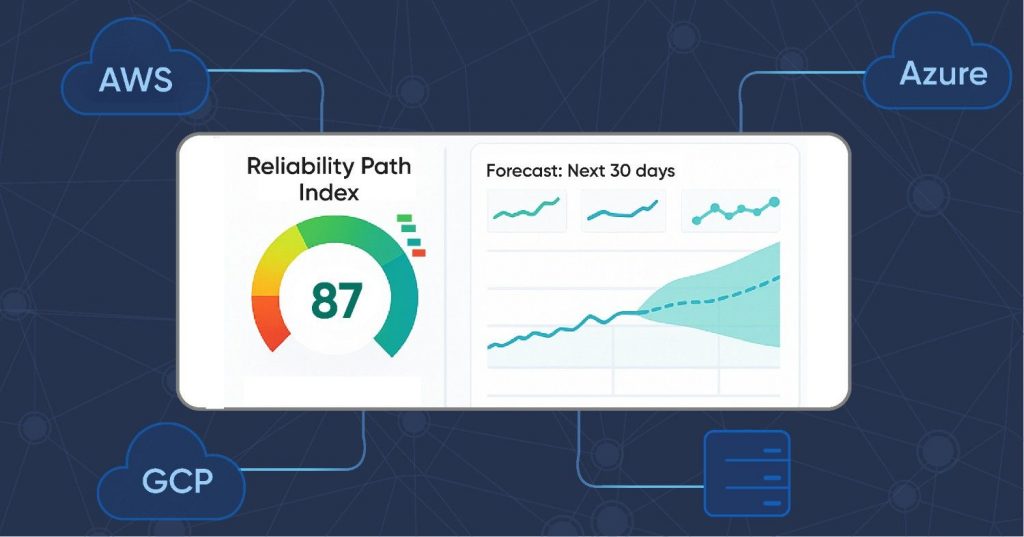
- Scout-itAI Cloud – X-ray visibility across every cloud path with multi-cloud reliability monitoring and AWS Azure GCP observability
- Scout-itAI Applications – Plain-language explanations of what’s slow, what’s breaking, and what’s causing user pain
- Scout-itAI Networks – Deep network performance analytics across every link, hop, and blind spot
For CIOs, CDOs, VPs of IT Operations, NOC managers and digital leaders, Scout-itAI is a strategic partner for:
- Unifying monitoring tools without ripping and replacing
- Standardizing how reliability is measured and reported
- Driving continuous reliability improvements with AI
Visit scoutitai.com to learn more and see how Scout-itAI itAI event intelligence fits your environment.
Getting Started with AI-Based Reliability Forecasting
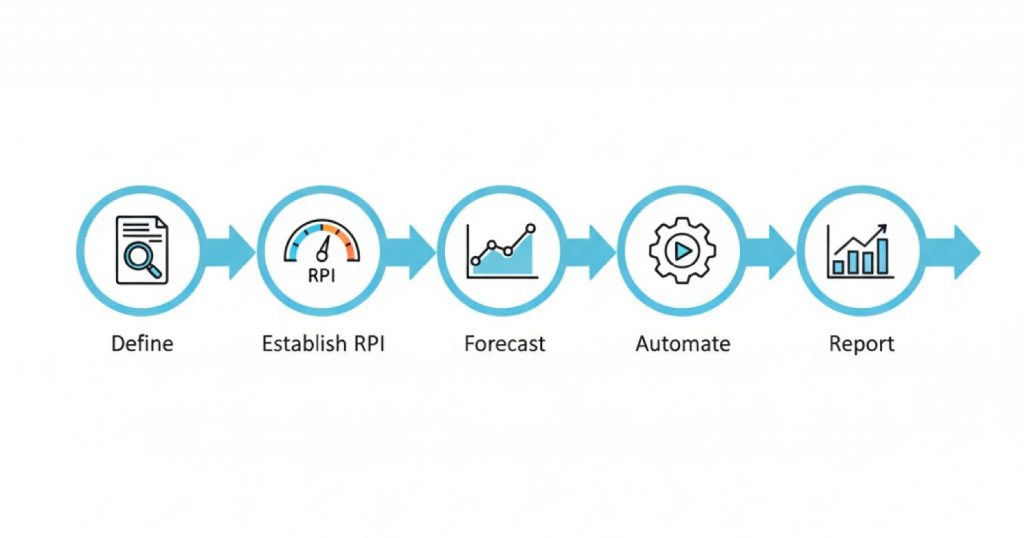
Ready to move beyond reactive uptime management and manual root-cause hunting? Here’s a practical starting point:
- Define what “reliable” means for your business
Identify the key digital experiences and services that matter most. - Standardizing how reliability is measured and reportedEstablish a reliability path index
Use ScoutITAi’s RPI score to normalize reliability across mainframe, cloud and network. - Layer in forecasting
Apply reliability forecasting for cloud services and Monte Carlo simulations to upcoming changes. - Automate where you can trust AI
Start with AI automation for incident management in lower-risk areas, then expand. - Report reliability in business language
Use unified RPI-based dashboards to brief executives and drive roadmap decisions.
Want to see AI-based reliability forecasting on your own data?
Book a demo with Scout-itAI or explore the platform to get started.
Frequently Asked Questions
A Reliability Path Index is a way to score the health of an end-to-end service path, from user to application to network. The ScoutITAi RPI score uses a 13-bucket model to convert complex telemetry into a single score for easier comparison and reporting.
You create a reliability score by combining key performance, availability and dependency metrics into a consistent model like RPI. ScoutITAi’s event intelligence service does this automatically, giving you a unified IT reliability score across mainframe, cloud and network.
AI-based forecasting combines historical telemetry, current conditions and Monte Carlo forecasting for IT reliability to simulate future outcomes. ScoutITAi’s Predictor runs thousands of simulations to show how changes will affect uptime and performance.
To measure reliability across hybrid cloud you need a layer that sits above your monitoring tools, normalizing signals from on-prem, cloud and network. ScoutITAi is a cloud-native observability and event intelligence platform that standardizes reliability metrics across all domains.
ScoutITAi focuses on 13 RPI buckets to drive noise reduction in observability. It correlates events using Six Sigma for IT operations and agentic AI, suppressing redundant alerts and surfacing what truly impacts reliability.
Kaufman Adaptive Moving Average (KAMA) helps separate real performance shifts from short-term noise. ScoutITAi’s Trender uses KAMA as an adaptive moving average for performance trends, so you can detect slow degradation early.
AI improves MTTR by correlating events, suggesting root causes and triggering guided or automated remediation. With AIOps for reliability and AI automation for incident management, ScoutITAi helps teams resolve issues faster with fewer manual steps.
No. While it’s great for engineers and NOC teams, ScoutITAi translates IT metrics to business language. It’s for CIOs, CDOs and other executives who need reliable, clear reliability reporting without technical detail.
ScoutITAi ingests telemetry from logs, metrics and traces, as well as network and cloud platforms and consolidates them into a single reliability dashboard. You keep your existing tools but get a single reliability view over them.
Start with a focused path or application, connect your existing observability tools and let ScoutITAi compute RPI scores and forecasts. Book a demo at scoutitai.com to see how AI-based reliability forecasting can help improve uptime and performance in your environment.

Tony Davis
Director of Agentic Solutions & Compliance