DevOps Guide to Network Observability
Introduction
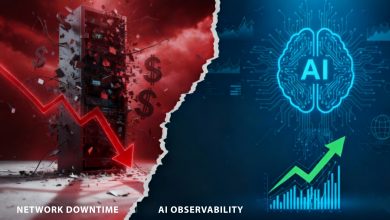
Teams wade through floods of alerts and dashboards, and the application and network stories often conflict. Hybrid cloud, microservices, SD-WAN, and remote work obscure visibility, while legacy tools lag. Network observability unifies signals from infrastructure, applications, and user experience to deliver real-time answers: what’s happening, why it’s happening, and the next step.
This guide explains how AI-powered monitoring and observability reduces alert noise, predicts incidents, and accelerates mean time to resolution (MTTR). It covers modern network observability platforms, how to unify application and network data for full-stack context, and the role of forecasting and plain language insights.
It also shows how ScoutITAi turns complex telemetry into business-ready guidance.
The impact of tool sprawl on system reliability
Many companies run separate tools for network monitoring, APM, log analytics and NPMD from multiple vendors. This breaks visibility and removes any single source of truth.
What this means- Alert overload: too many notifications with too little context.
- Siloed metrics: no correlation across infrastructure, applications, and networks.
- Manual root cause: investigations take longer, MTTR stays high, and customer impact grows.
Get a network observability platform that unifies telemetry, applies business context and automates the next best action.
Turn dashboards into decisions. Access the AI Network Observability Action Pack audit, baseline, and forecast before you deploy
AI-First Observability for Hybrid Enterprises: Agentic and Generative
AI has moved from accessory to engine. We’re moving from people piecing things together after the fact to AI interpreting signals and taking smart action, with humans setting goals and guardrails.
- Agentic AI coordinates specialist sub-agents that spot anomalies, map dependencies, analyze network traffic, and carry out remediation when it’s safe to do so.
- Generative AI turns noisy, encrypted telemetry into plain-language insights and step-by-step runbooks, lightening the load for on-call teams.
- Forecasting and simulation move the conversation from “What broke?” to “What might break, and how do we prevent it?”
ScoutITAi combines an agentic workforce with GenAI insights and quantitative reliability models, helping you resolve issues quickly and justify investments with real, defensible numbers.
Explore the platform: ScoutITAi Cloud, ScoutITAi Applications, ScoutITAi Networks
A DevOps framework for network observability
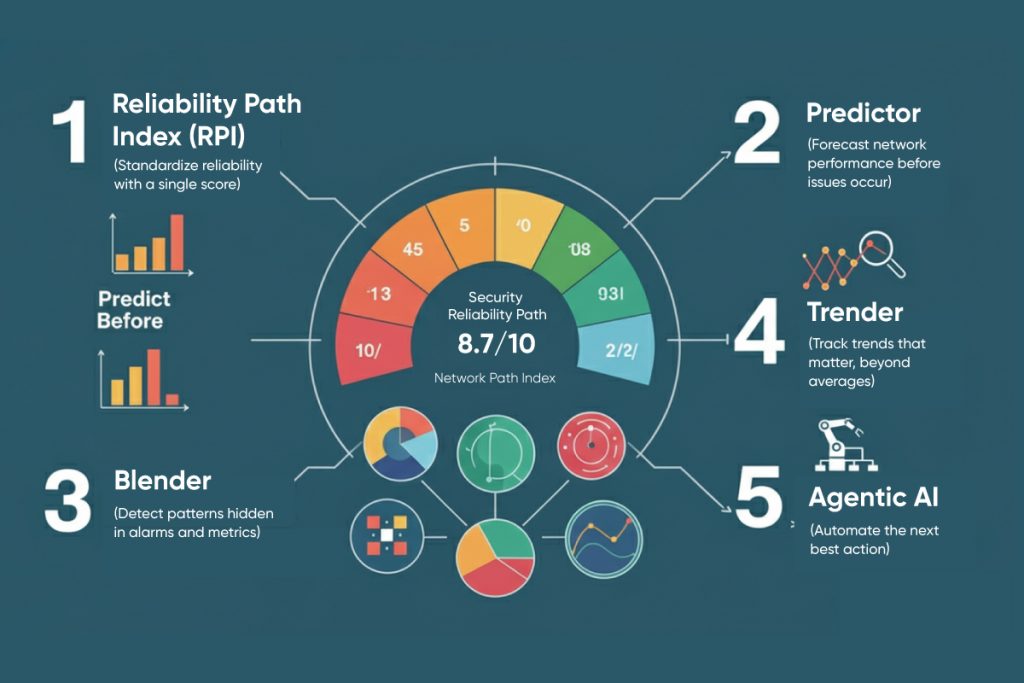
1) Standardize reliability with a single score
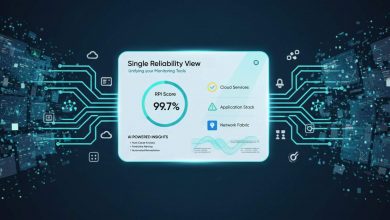
ScoutITAi’s Reliability Path Index (RPI) condenses thousands of signals into a patented 13-bucket score comprehensible by engineers and executives. It democratizes observability so everyone can see which paths, regions, or services are at risk.
2) Predict before you page
Use Predictor (Monte Carlo Forecasting) to simulate up to 100,000 scenarios and see how network or capacity changes might influence reliability. This elevates planning from guesswork to reliable ROI.
3) Find patterns that humans miss
Blender (Six Sigma Analysis) correlates alarms and metrics in real time to expose performance-impacting patterns, pinpointing where noise hides real signal.
4) Track trends that matter
Trender, powered by Kaufman’s Adaptive Moving Average (KAMA), continuously compares performance against a rolling 100-day baseline, spotting subtle degradations that traditional moving averages often miss.
5) Automate the next best action
Agentic AI transforms insights into intelligent, policy-driven actions, automating guided fixes, accelerating resolution times, and eliminating repetitive manual effort.
Legacy monitoring vs AI observability
| Data unification | Per-tool dashboards | Unified reliability view across clouds, apps, networks |
| Noise handling | Thresholds, static rules | Six Sigma correlation with noise suppression |
| Forecasting | Rare or manual | Monte Carlo simulations to assess change impact |
| Trend detection | Simple averages | Adaptive KAMA against rolling 100-day baselines |
| Actionability | Human-driven triage | Agentic AI with guided remediation |
| Business context | Tech metrics only | RPI score aligned to business risk |
Practical steps to modernize your stack
1. Unify telemetry around reliability paths
Map user journeys and critical services first. Then prioritize network monitoring tools, application monitoring tools, and cloud monitoring software that feed those paths. The goal isn’t to collect more data; it’s to achieve better correlation.
2. Replace rules with learned baselines
Static thresholds create false positives. Use models that adapt (like KAMA) so you can detect in real time without drowning in noise.
3. Run what-if simulations
Before rolling out a new WAN policy or cloud route, run “what-if” simulations with Predictor to see how your RPI will change. This bridges DevOps and leadership with quantifiable tradeoffs.
4. Automate the easy, guide the hard
Let agentic AI take first action on predictable issues (cache flushes, route failover, service restarts) and provide plain language runbooks for hard cases.
5. Report in a language everyone understands
Publish reliability rollups by business service, region, or customer segment. With RPI, CIOs and VPs finally get non-technical updates they can act on.
Must-have capabilities in a modern observability platform
When looking at observability solutions or network monitoring solutions, consider:
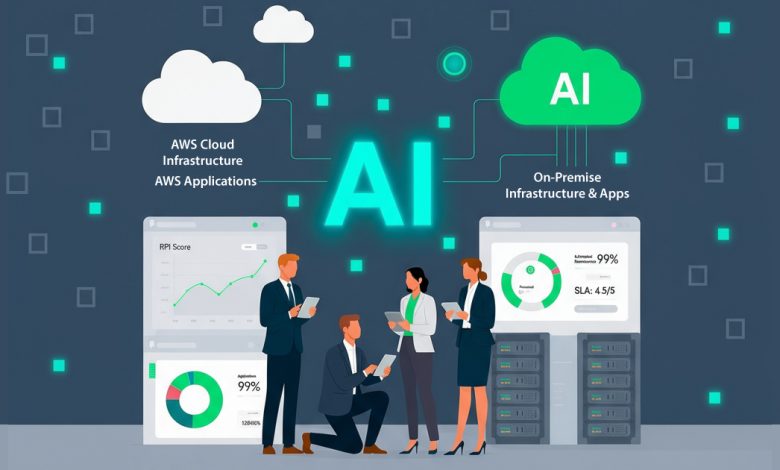
- Universal hybrid coverage: AWS, Azure, GCP, on-prem, SD-WAN, remote users
- Full-stack observability: app + infra + network in one view
- Real-time network monitoring with historical context (12+ months)
- Network traffic analysis tools and network troubleshooting tools built-in
- Cloud network monitoring tools for inter-region, inter-VPC, egress, and edge paths
- Noise reduction via correlation and Six Sigma methods
- AI monitoring and AI observability (agentic + generative)
- Business-aligned scoring (e.g., RPI) so leaders and engineers are aligned
- Open ecosystem integrations (Splunk, Dynatrace, Broadcom DX NetOps/OI, AppNeta)
- Governance to minimize drift and hallucination, with explainable insights
Real results DevOps can expect
By automating routine fixes and steering responders with clear runbooks, teams resolve faster and fewer incidents. Noise goes down as the Six Sigma correlation surfaces true anomalies, and leaders get board-ready visibility through the RPI score.
Meanwhile, Monte Carlo models show the payback of each improvement, so you can make smarter, higher-ROI decisions.
How ScoutITAi fits your toolchain
If your stack already includes application monitoring, network management platforms, or cloud observability tools, ScoutITAi layers across your estate to integrate, correlate, and explain telemetry so you keep what works and retire what doesn’t.
Operating as an enterprise observability control plane, it works with the best network monitoring tools you already own, adds AI monitoring software capabilities without disrupting your setup, scales seamlessly from remote network monitoring to multi-cloud backbones, and incorporates insights from network security monitoring tools to deliver risk-aware reliability.
Conclusion
The future of DevOps and IT operations is AI-powered network observability. By unifying telemetry, reducing alert fatigue, and delivering predictive insights, you can improve reliability, optimize performance, and align IT to business goals. ScoutITAi offers a new way to observability, combining agentic AI, generative insights, and predictive forecasting for IT teams and business leaders.
Try ScoutITAi today to transform your network monitoring, reduce downtime, and get full-stack observability across your enterprise.
Frequently Asked Questions
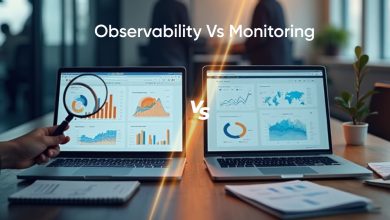
Monitoring checks known metrics and thresholds. Observability unifies logs, metrics, traces, and flow/packet data to explain why issues occur and what to do next—often with AI-driven guidance that reduces MTTR.
ScoutITAi’s agentic AI correlates signals across tools, applies real-time Six Sigma analysis (Blender) to suppress noise, and produces plain-language insights. You get fewer, richer alerts tied to business impact via the RPI score.
Yes. ScoutITAi integrates with Splunk, Dynatrace, AppNeta, and Broadcom DX NetOps/OI—consolidating telemetry into a unified, reliability-centric view without forcing a rip-and-replace.
Use ScoutITAi’s Reliability Path Index (RPI), a patented 13-bucket score that condenses thousands of metrics into a single, business-friendly view of reliability by service, region, or customer journey.
Predictor runs up to 100,000 Monte Carlo simulations to forecast how changes—like capacity, routing, or policies—could shift the RPI score, helping prevent downtime and prioritize investments with measurable ROI.
Trender applies Kaufman’s Adaptive Moving Average (KAMA) against a rolling 100-day baseline to surface subtle trend drift and early performance regressions long before they become incidents.
Yes. ScoutITAi’s agentic workforce framework includes orchestrators, sub-agent guardrails, and explainability so recommended actions are auditable and aligned with policy.
ScoutITAi supports AWS, Azure, GCP, and on-prem environments—providing full-stack and network observability across hybrid and multi-cloud infrastructures, including remote network monitoring and SD-WAN.
ScoutITAi correlates traces, logs, metrics, and flow/packet data into a single reliability narrative. GenAI explains whether the bottleneck is in code, service dependencies, or the network path so APM and NPM teams stay aligned on root cause and next steps.
ScoutITAi ingests telemetry (metrics, logs, traces, flows, alarms) and configuration data from your existing tools. PII-sensitive fields can be redacted or hashed. Data is encrypted in transit and at rest, with role-based access and auditability to meet enterprise security and compliance needs.

Tony Davis
Director of Agentic Solutions & Compliance
