How the Reliability Path Index (RPI©) is Redefining IT Service Reliability

Introduction
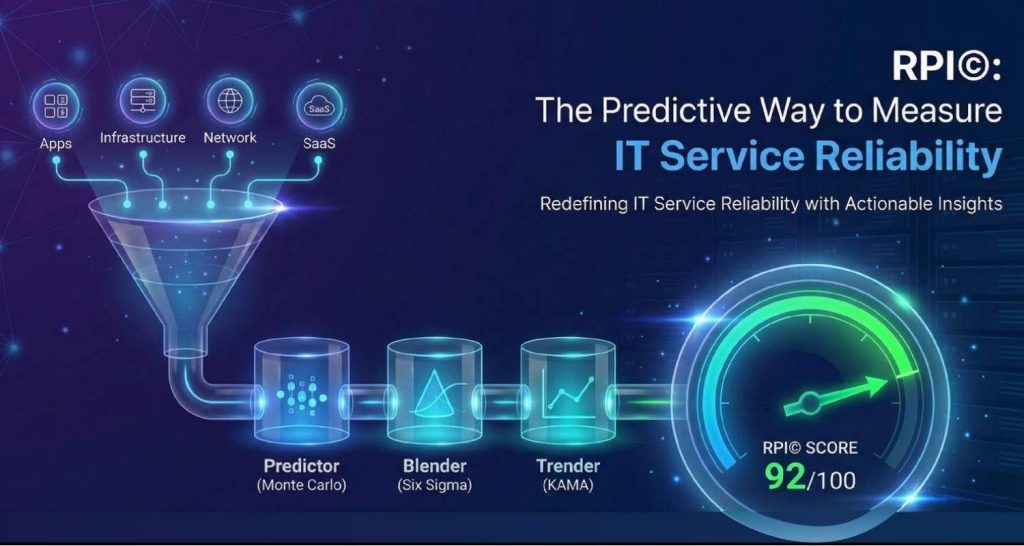
Modern businesses need a predictive service reliability score that turns complex telemetry into actionable decisions. RPI© does this by combining cross-domain signals from applications, infrastructure, networks, and third-party/SaaS paths into a single, business-readable metric. Powered by Monte Carlo forecasting, Six Sigma diagnostics, and KAMA trend tracking, RPI© identifies the variables that depress reliability and quantifies the expected lift before changes are deployed. With agentic AI insights, it provides transparent, executive-ready reporting and a measurable roadmap for continuous improvement.
Check out the blog and its components, and review the full model with examples on the RPI-index© page.
The engines behind RPI©
RPI© isn’t just a formula; it’s an analytics system that shows where to intervene and what to expect.
- The Predictor Monte Carlo “what-if” forecasts:
Runs up to 100,000 simulations to estimate RPI© gains from proposed changes (e.g. reducing a specific path’s latency), so you can prioritize fixes with measurable outcomes. Amazon Web Services, Inc. - The Blender on-the-fly Six Sigma analysis:
Finds performance patterns across disparate alarms and metrics, surfacing statistically significant drivers you can act on fast. - The Trender KAMA-based trend tracking:
Uses Kaufman’s Adaptive Moving Average to compare current RPI© to a 100-day baseline and flag meaningful shifts (not noise).
Together, these make RPI© actionable, forecastable, and explainable at the exec and engineering levels.
RPI© Executive Guide: How to Predict Service Reliability Before Users Are Impacted
Why RPI© is redefining IT service reliability
- One score everyone understands
RPI© makes reliability democratic: execs see risk and trend, engineers see the exact contributors, and both agree on priorities. - From reactive to preventive
Predictive simulations show the most impactful change before you do it, reducing MTTI/MTTR and SLA breaches. - Cross-domain visibility beyond your walls
Scout-itAI uses both active and passive monitoring to mirror user paths across third-party networks and SaaS hops you don’t control so blind spots shrink. - Built for the stack you have
API-driven integrations with tools like ServiceNow, Splunk, Dynatrace, AppNeta, and Broadcom O2, across AWS, Azure, GCP and on-prem. - Faster time to value
After initial implementation, teams can add apps and start monitoring in minutes, with up to 12 months of performance insight out of the box.
RPI© vs Health/SLO Scores
| Platform | Score type | Prediction | Path coverage (3rd-party) | Business readability |
| RPI© (Scout-itAI) | Path-centric service reliability score (single metric) | What-if forecasts (e.g., Monte Carlo), trend verification | Yes (active + passive signals across delivery paths) | High executive-friendly, one score + drivers |
| Splunk ITSI | Service Health Score = weighted KPI severities (Service Analyzer / Glass Tables) | Primarily descriptive | Indirect depends on data you ingest (KPIs, searches) | Moderate configurable dashboards, glass tables Splunk Docs+2Splunk Docs+2 |
| Datadog | Service Health from monitors, incidents, Watchdog | Descriptive status; anomaly surfacing | Indirect via Synthetic Monitoring/endpoints, not a path-level reliability score | Moderate unified service page & state summaries Datadog Monitoring+1 |
| Dynatrace (Davis AI) | AI-driven root-cause across causal topology (problems) | Causal analysis (not a unified reliability score) | Indirect focus on instrumented topology; external visibility via DEM/synthetics | Moderate problem cards with RCA context Dynatrace Documentation+1 |
| Nobl9 | Reliability Score from SLO roll-ups | Security, Risk, Board | Depends on SLI sources you connect; not a path monitor | High exec/eng alignment via SLO dashboards & reports docs.nobl9.com+2 |
How to use RPI©
Step 1: Baseline the service.Connect the target application, define the delivery path and get an initial RPI© score.
Step 2: Identify the biggest drags.Use Blender insights to see which domains (e.g. packet loss on a path, p95 latency spikes, a SaaS dependency) are dragging the score down.
Step 3: Run “what-if” forecasts.With the Predictor, simulate changes (e.g. improve path jitter by 20%) and see the RPI© lift and user impact. Amazon Web Services, Inc.
Step 4: Prioritize, implement, verify.Deploy the change with expected lift and then validate in Trender as the KAMA-based trend line moves in the right direction.
Step 5: Automate wins.Tie repeatable fixes into ITSM (e.g. ServiceNow) and your observability stack so fixes scale.
What changes when you manage to an RPI© target?
- Clear SLOs linked to a score the business understands.
- Fewer fire drills thanks to early signal detection on the exact path that’s failing.
- Credible ROI narratives (“a 5-point RPI© lift after network path tuning”) for leadership and customers. scoutitai.com
Where RPI© excels
- E-commerce peak events: Forecast the reliability impact of CDN or DB changes before Black Friday; prove the effect post-deploy in RPI©.
- SaaS dependency risk: Show how a third-party outage affects your score and customer experience; build playbooks that automatically mitigate.
- Branch/retail networks: Compare locations by RPI© and fix the outliers first for the biggest CX gain.
- Cloud migrations: Use RPI© to validate new architectures across AWS/Azure/GCP and avoid “it looked fine on the dashboard” surprises. Amazon Web Services, Inc.
Conclusion
The Reliability Path Index (RPI©) gives IT and business leaders a single predictive reliability score mapped to real delivery paths plus diagnostics to surface true drivers and a forecast of expected lift before any change. Ready to replace dashboard noise with measurable outcomes?
Book a Scout-itAI demo to see your RPI baseline and projected gains, or start a free trial at scoutitai.com.
Frequently Asked Questions
No. SLIs/SLOs are useful targets, but RPI© unifies multiple domains into one predictive score and tells you which drivers to fix for the biggest lift.scoutitai.com.
When fully implemented, RPI© can achieve R² greater than 0.9, enabling reliable prediction for triage and continuous improvement.
Yes. Scout-itAI combines active and passive monitoring to follow real user-like paths across third-party networks and SaaS apps.
Post-implementation, you can add apps and start monitoring within minutes; the platform also provides up to 12 months of performance insight.
Scout-itAI supports AWS, Azure, GCP, and on-prem environments, integrating with ServiceNow, Splunk, Dynatrace, AppNeta, Broadcom O2, and more. Amazon Web Services, Inc.
RPI© ingests application, infrastructure, and network telemetry, plus active (synthetic) and passive signals. It works alongside tools such as Splunk, Dynatrace, AppNeta, and Broadcom DX NetOps/OI, and spans AWS/Azure/GCP and on-prem environments.
Once core telemetry is connected, teams can capture an initial reliability baseline quickly and begin tracking a KAMA trend; prediction confidence strengthens as more history accrues.
Yes—RPI© is path-centric. You can scope specific services, adjust variables and thresholds, and set business targets to create a service-appropriate reliability improvement roadmap.
No. RPI© sits above your stack to unify signals into a single service reliability score and add predictive planning. Keep APM/DEM for deep RCA and traces; use RPI© to prioritize and forecast impact.
RPI© pairs insights with agentic AI to suggest or trigger playbooks (e.g., via ITSM/observability integrations). Predictor quantifies expected lift before action; Trender verifies results after.

Tony Davis
Director of Agentic Solutions & Compliance

