Introduction
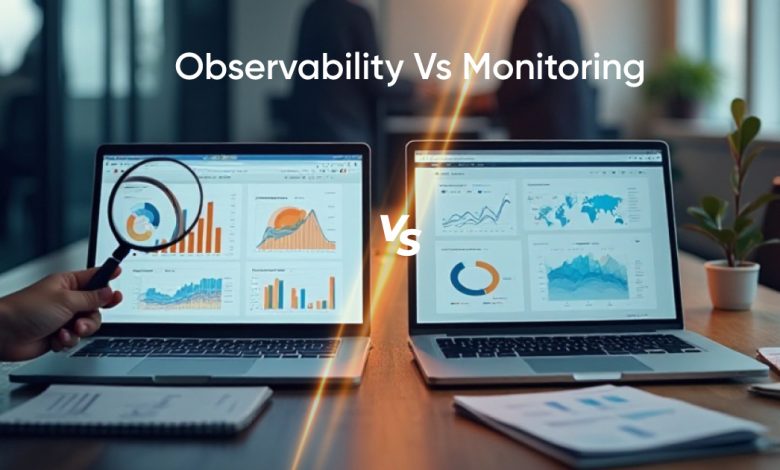
Traditional network monitoring tells you something is wrong. Network observability tells you why it’s wrong, where the issue started, and how far it has spread.
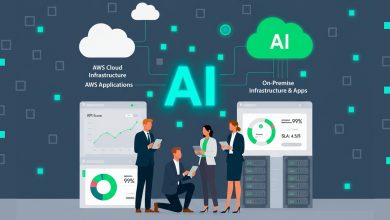
In 2025, this difference matters more than ever. Hybrid cloud, Kubernetes observability, and multi-cloud deployments have made IT environments too complex for threshold alerts alone. Monitoring gives you a red light. Observability gives you the full story.
The 2025 IT Infrastructure Challenge
Modern infrastructure is highly dynamic:
- Services scale up or down in seconds
- Traffic shifts between regions
- Users connect from multiple networks and devices
IT teams face:
- Different cloud log formats and metrics
- Microservices that turn one click into dozens of east‑west hops
- Remote users and edge sites outside the classic perimeter
The result: more signals, more noise, and longer hunts for the root cause.
Why the Old Monitoring Approach Falls Short in Modern Networks
Threshold-based alerts are good at saying “something is broken” but not why.
In distributed systems, symptoms often appear far from the root cause:
- A retry storm in one service creates packet drops elsewhere
- A Kubernetes policy change silently blocks a dependency
- Latency spikes occur because of network congestion two hops away
Monitoring surfaces the symptom. Observability connects the dots.
What Is Network Monitoring?
Definition and Core Purpose
Network monitoring tracks known health indicators like uptime, latency, packet loss, and device utilization and alerts when thresholds are breached. Its purpose is guardrails, SLA/SLO compliance, and escalation to engineers.
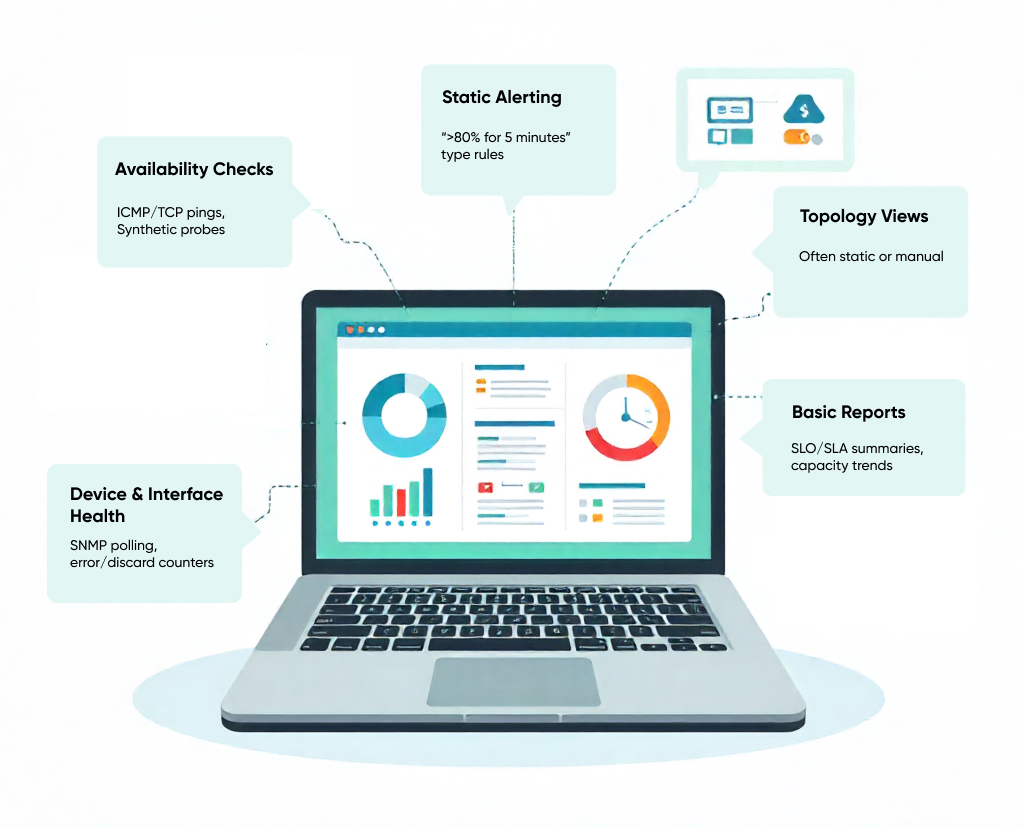
Common Features of Traditional Network Monitoring Tools
- Device & interface health: SNMP polling, error/discard counters
- Availability checks: ICMP/TCP pings, synthetic probes
- Static alerting: “>80% for 5 minutes” type rules
- Topology views: Often static or manual
- Basic reports: SLO/SLA summaries, capacity trends
Limitations in Hybrid and Multi‑Cloud Environments
- Static thresholds create noise as traffic patterns shift
- Device‑centric views hide service‑to‑service relationships
- Metrics/logs differ across clouds and are hard to compare
- Teams spend time correlating across tools instead of fixing issues
What Is Network Observability?
Simple Definition
Observability is the ability to ask new questions about your network without rewriting rules each time. It pulls together metrics, logs, traces, and network flow data (and, increasingly, profiles) so you can follow a request across layers (L3–L7) and across platforms (on‑prem, cloud, and edge) to the real cause.
How It Goes Beyond Monitoring
- Traces show the exact path a request takes through services and networks
- Flow/packet insights reveal who talked to whom and what happened en route
- Logs add context: deploys, policy changes, config diffs
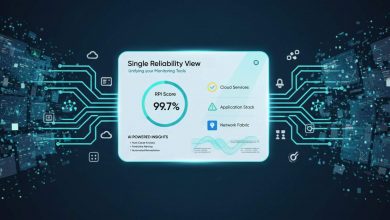
- Correlation ties it all together so you see cause, effect, and blast radius in one view
Core Capabilities of an Observability Platform in 2025
- Unified telemetry pipelines for metrics, logs, traces, flows (profiles emerging)
- Service‑aware network maps across clusters and clouds
- AI‑assisted de‑noising and event correlation to cut false pages
- Business context (SLOs, user impact) next to technical metrics
- Flexible queries by service, path, region, or policy—no re‑instrumenting
- Governance with RBAC, audit trails, and sensible retention
Key Differences Network Observability vs Traditional Monitoring
| Feature | Traditional Monitoring | Network Observability |
| Primary goal | Detect symptoms | Explain causes & impact |
| Data scope | Metrics, checks | Metrics, logs, traces, flows, profiles |
| View | Device‑centric | Service‑ & path‑aware |
| Alerting | Static thresholds | Context‑aware, de‑noised |
| Troubleshooting | Manual correlation | Automated correlation & guidance |
| Topology | Often static | Live service/network map |
| Cloud coverage | Single/limited | Hybrid and multi‑cloud normalized |
| User impact | Indirect | Quantified with SLOs/KPIs |
| Governance | Basic | RBAC, audit, retention |
| Outcome | “It’s red.” | “It’s red because X; fix Y” |
Why the Shift to Network Observability Is Accelerating in 2025
AI and Machine Learning
AIOps now clusters alerts, learns normal patterns, and highlights meaningful anomalies, reducing noise and alert fatigue.
Cloud-Native Architectures
Kubernetes and microservices increase network complexity. Observability tools trace requests across services to pinpoint where latency or errors occur.
Security and Compliance
Richer telemetry strengthens security operations and compliance. You can trace suspicious flows, audit policy changes, and produce clear evidence during reviews. When incidents happen, end‑to‑end context speeds both containment and reporting.
Pros and Cons of Network Monitoring
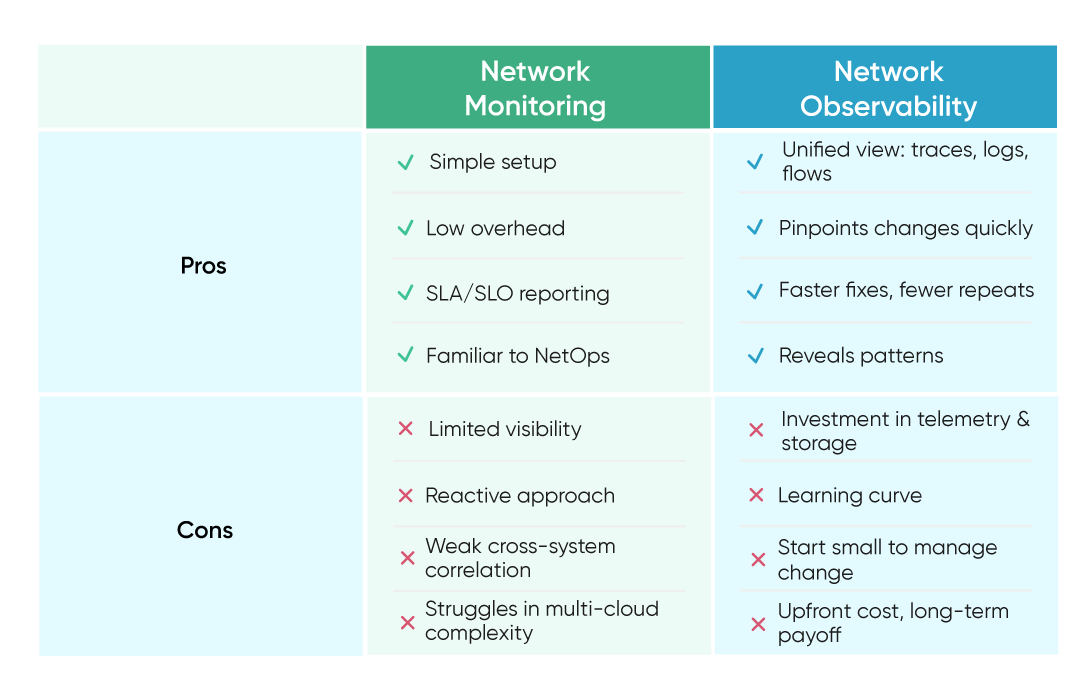
Choosing Between Network Monitoring and Observability
- Use monitoring for small, stable networks, basic uptime checks, internal systems
- Use observability for customer-facing services, Kubernetes/microservices, multi-cloud, compliance-heavy environments
Best practice: Combine both. Use monitoring for guardrails and observability for deep troubleshooting and prevention.
Real‑World Use Cases and Industry Examples
Finance: Payment API slows down → Monitoring shows latency → Observability traces reveal a misconfigured dependency → Fixed in minutes, not hours.
Telecom: Healthy metrics but customer jitter → Observability correlates RAN and transport data → Policy misfire identified.
Manufacturing: Nightly batch job saturates link → Observability finds the culprit → Rescheduling avoids costly hardware upgrades.
Next-Gen Network Insights: Observability vs Monitoring 2025
Implementation Guide for Moving from Monitoring to Observability
- Assess Your Tools: Inventory metrics, logs, and flows. For guidance, check ScoutITAi for observability solutions.
- Map Dependencies: Document service-to-service relationships
- Define Goals: Reduce noise, improve MTTR, tie to business impact
- Unify Telemetry: Create a single pipeline for metrics/logs/traces
- Start Small: Pilot on a critical service
- Leverage AI: Enable alert grouping and anomaly detection
- Train Teams: Teach trace following and flow interpretation
- Automate Remediation: Add runbooks for repetitive fixes
The Future of Network Visibility
Predictions for AI‑Enhanced Observability by 2030
AI will explain, not just alert: “Because of X, fix Y, risk Z.” Richer telemetry, smarter storage, and built-in security context will become standard.
The Ongoing Role of Traditional Monitoring in Niche Scenarios
Monitoring isn’t going away. It remains the simplest way to enforce guardrails, check uptime, and verify SLOs. For stable, low‑risk systems, it’s often enough.
Conclusion
At ScoutIT, we believe the smartest way to keep networks healthy is by combining network monitoring and network observability. Monitoring gives you uptime guardrails and SLA/SLO tracking, while observability quickly pinpoints issues, cuts MTTR, and improves performance. Start with one critical service, show quick wins, then expand across your network. Book a demo with ScoutITAi to reduce downtime and deliver a smoother digital experience.
Frequently Asked Questions
It provides developers and operators with shared visibility into network and service behavior, speeding collaboration and reducing finger-pointing during incidents.
Yes. By identifying inefficient network paths or excessive retries, teams can optimize traffic and reduce wasted compute resources.
No. Even mid-sized businesses benefit from reduced MTTR and improved user experience, especially in SaaS or customer-facing apps.
Modern observability platforms use metadata, flow data, and endpoint telemetry instead of deep packet inspection, preserving security and compliance.
Not necessarily. Many observability solutions integrate with existing monitoring stacks, allowing a gradual transition.
With machine learning, observability platforms can detect patterns that precede failures and alert teams before users are impacted.
Application observability focuses on code-level performance, while network observability follows data paths, dependencies, and flows across infrastructure.
There is a learning curve, but most platforms offer intuitive visualizations and guided root-cause analysis.
It depends on compliance and business needs, but many organizations keep high-fidelity data for days and aggregated data for months.
Faster resolution, reduced downtime, fewer SLA violations, and improved customer experience often justify the investment within months.

Tony Davis
Director of Agentic Solutions & Compliance