Introduction
Modern IT operations are plagued by a tidal wave of logs, metrics, traces and alerts – and if you’re in charge of IT Ops, NetOps or SRE, you know the problem all too well. You’re not short on monitoring tools,Despite this, you often have a nagging lack of confidence in service reliability.
As a result, Teams are struggling to make sense of disconnected dashboards and are drowning in alert fatigue. Meanwhile, when leaders ask the obvious question – are we reliable? Where are the risks? What do we do next? – the uncertainty grows and the Mean Time To Resolve (MTTR) goes up.
That’s exactly why we need actionable reliability insights – plain language answers that transform raw telemetry into business-aligned decisions.
In this blog we’ll take a closer look at why traditional observability just isn’t cutting it, how AI-driven operations can turn the tables, and how Scout-itAI helps turn data overload into reliable outcomes.
Why IT Data Overload Is Hurting Reliability
You’d think that with all the investment in monitoring and observability tools that reliability issues would be a thing of the past. Unfortunately, that’s not the case.
In reality, more data hasn’t translated into better reliability. Instead, it introduced new complexity.
The Common Pain Points in IT Operations
In practice, these challenges show up in several ways:
- Too many tools and not enough useful answers: infrastructure, application and network monitoring all seem to live in separate silos.
- Alert fatigue is a real thing: thousands of alerts fire every single day, yet most of them are low value or redundant.
- Metrics are often stuck in their own little world: teams can’t easily correlate events across domains.
- It’s all too manual: engineers are spending hours digging through dashboards trying to figure out what’s going on.
- Business execs can’t make sense of it: reliability data is coming out in a language that only the techies can understand.
Taken together, this piecemeal approach slows incident response, increases MTTR, and puts the business at risk.The problem isn’t a lack of data. Instead, it’s the inability to turn that data into actual insights.
The Actionable Reliability Blueprint: A Framework to Transition from Tool Sprawl to Predictive Insights
From observability to event intelligence: the shift that matters
Observability helps you see what’s happening, However, when telemetry is flowing in all directions, seeing just isn’t enough. At scale, you need a system that can interpret signals, connect context, and guide action.
This is where Event Intelligence comes in: taking all those disconnected signals and turning them into a coherent reliability story. Scout-itAI focuses on turning telemetry into a narrative about reliability. From there, AI connects the dots and highlights what actually matters.
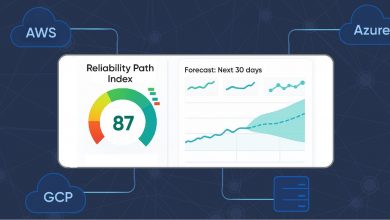
On the Scout-itAI platform, data from multiple monitoring domains is combined into a Reliability Path Index (RPI) score. This score shows how reliable your service is and what’s driving that reliability. Scout-itAI
A Simple Framework for Turning Telemetry into Decisions
To make data actionable, teams need a clear framework:
- Unify all those signals into one language
- Focus on the biggest reliability drivers (not every metric)
- Forecast the impact before you make a change
- Translate all your technical findings into language that business people can understand
- Automate the next best action safely
Scout-itAI makes this possible with a combination of reliability scoring, AI guidance, dashboards and agentic design. Scout-itAI
Quick comparison: traditional monitoring vs actionable reliability insights
| Capability | Traditional Monitoring | Scout-itAI Approach |
| Primary output | Dashboards + alerts | Reliability outcome + guided actions |
| Correlation | Manual (human-driven) | AI-assisted cross-signal interpretation |
| Exec communication | Tech KPIs | Plain-language reliability narrative |
| Change planning | Guesswork + hope | Forecast reliability impact before change |
| Noise management | More thresholds | Focus on reliability drivers that matter |
If the “single pane of glass” is going to work, then it must answer one core question: How reliably is the service being delivered right now and what’s driving that?
Reliability you can explain: the Reliability Path Index (RPI)
Most monitoring programs fail the executive test. They focus on charts, but don’t provide clarity.
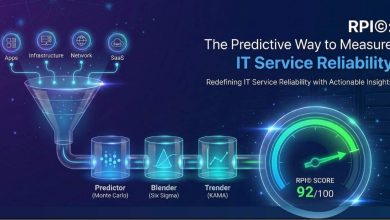
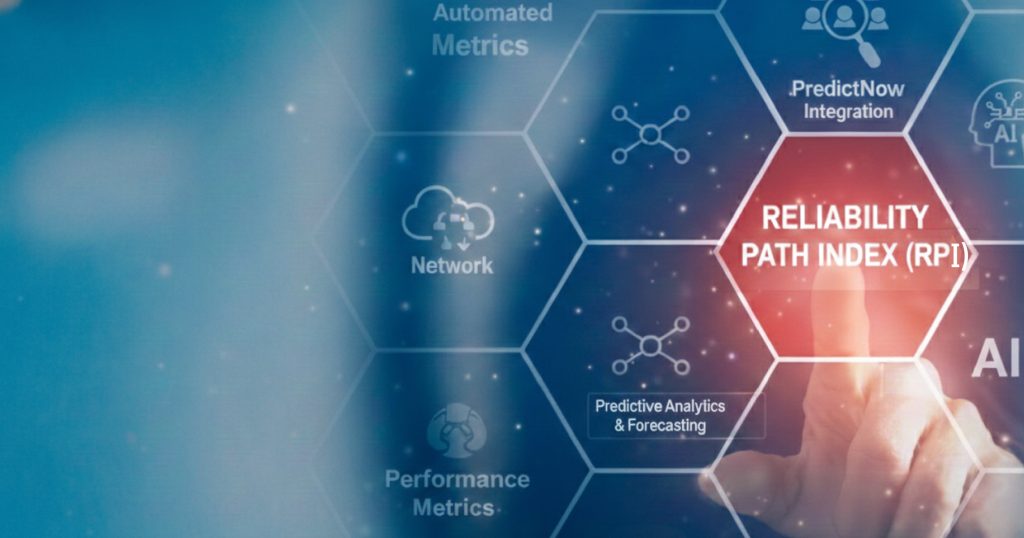
To solve this, Scout-itAI introduced the Reliability Path Index (RPI).RPI expresses reliability as something you can measure and communicate without losing engineering accuracy. In simple terms, RPI is a predictive metric. It uses multiple variables and monitoring domains to measure service reliability across all delivery paths.
Instead of asking stakeholders to interpret dozens of KPIs, teams see a single reliability score. From there, they can drill down to understand what’s driving the number.
If you want to see how RPI works, you can start here: Reliability Path Index (RPI).
Predictive operations: forecast reliability before you spend
Preventing incidents is better than fixing them afterward. However, prevention requires more than anomaly detection. It requires forecasting. – Instead of asking, “Will this help?” teams can ask, “If we do X, what happens to reliability?” Scout-itAI uses Monte Carlo simulations up to 100,000 iterations to forecast reliability outcomes. As a result, teams can understand the impact of changes before they deploy them.The real difference is between:
“We think this upgrade will help” – and “We expect a measurable reliability improvement, and here’s why”.
And that’s especially useful for:
- Sifting through that reliability backlog and figuring out what’s most important
- Planning cloud migrations with confidence
- Justifying that tooling consolidation to your leadership team
- Actually quantifying the reliability return on investment for the ones calling the shots
The AI solution that makes you trust your reliability data
There’s a trust problem with AI in operations. When recommendations feel like a black box, teams ignore them or worse, follow them blindly.
To address this, Scout-itAI focuses on explainability. It delivers clear AI-driven issue identification and operational guidance that improves decision-making.
On top of that, Scout-itAI applies Promise Theory to reliability and autonomous decision governance. This reduces black-box anxiety and increases confidence. Scout-itAI
This all lines up with a broader industry trend: combining observability with agentic AIOps so systems can actually explain what’s going on – not just detect stuff.
Making it real: what ‘actionable’ looks like day-to-day
Actionable reliability insights aren’t thirty-page incident reports. Instead, they’re concise operational guidance:
- What’s broken now: “Checkout latency is spiking in Region A due to packet loss on a key path.”
- What’s at risk: “Customer experience will degrade within 20 minutes if this continues.”
- What to do next: “Validate path health, isolate the degraded hop, and confirm reliability score improvement.”
Scout-itAI’s dashboard supports real-time visibility and historical comparison. As a result, teams can easily compare “now” versus “then.”
For new teams, Help Guides provide a fast operational walkthrough. Scout-itAI
Conclusion
Your monitoring stack shouldn’t produce more noise. It should produce clarity.
When IT data is converted into a shared reliability language, when changes are forecast before deployment, and when AI safely guides action, reliability stops being reactive.
Ultimately, it becomes a measurable program that engineers and executives can follow together.
Ready to turn telemetry into actionable reliability insights? Explore Scout-itAI and Book a Demo to see how reliability scoring, AI guidance, and forecasting work together in your environment. Scout-itAI
Frequently Asked Questions
IT data overload occurs when organizations collect massive amounts of telemetry but lack the tools to convert it into actionable insights.
AI correlates signals, reduces noise, predicts failures, and translates raw telemetry into clear, actionable recommendations.
Actionable reliability insights explain risk, identify root causes, and recommend next steps—clearly aligned with business impact.
An AIOps platform uses AI to automate IT operations, detect anomalies, correlate events, and continuously improve service reliability.
Scout itAI focuses on 13 core reliability metrics and applies statistical analysis to eliminate noise, ensuring teams see only what truly matters.
The Reliability Path Index (RPI) is a patented scoring system that condenses thousands of metrics into a single, easy-to-understand reliability score.
Yes, Scout itAI integrates seamlessly with existing tools such as Splunk, Dynatrace, and AppNeta.
Scout itAI uses Monte Carlo simulations to predict how configuration changes, failures, or growth scenarios will impact reliability.
Mid-to-large enterprises operating complex, hybrid, or multi-cloud IT environments benefit the most from Scout itAI.
Yes, Scout itAI delivers plain-language insights that directly align reliability data with business outcomes.

Tony Davis
Director of Agentic Solutions & Compliance