Introduction
If you manage IT or network operations, you’re probably juggling multiple dashboards, APM consoles, chat windows and cloud tools yet business users still report outages before your systems do. Most organizations now use several observability tools but still lack full-stack visibility, driving up downtime costs. The problem isn’t data volume; it’s a fragmented monitoring story.
That’s where single pane of glass monitoring and a single view of reliability come in an agentic, AI-powered platform like Scout-itAI acts as the glue across your monitoring stack, instead of just becoming one more dashboard.
The real cost of monitoring tool sprawl
Monitoring tool sprawl started with good intentions: best-of-breed tools for everything network, apps, cloud, security, digital experience. But now:
- NetOps teams in one recent study said 87% of them use multiple observability tools, and only 29% of alerts are truly actionable.
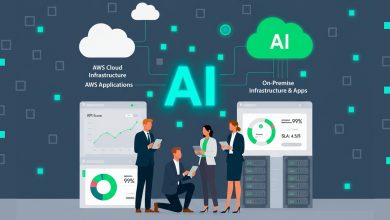
- Most organizations now run multi-cloud (AWS, Azure, GCP) in parallel, with 89% using a multi-cloud strategy each with its own consoles and agents.
The result?
- You have multiple monitoring tools that can’t talk to each other.
- You lose time during incidents hopping between infrastructure monitoring tools, application performance monitoring (APM) and cloud monitoring tools.
- Your incident response and reliability metrics suffer because you’re reconstructing the story manually in the heat of the moment.
- MTTR and uptime monitoring
a) Every extra click and context switch slows triage.
b) Outages last longer than they should. - SRE reliability metrics & error budgets
a) SLOs live in one tool, SLIs in another and logs somewhere else.
b) Error budget monitoring becomes a spreadsheet exercise instead of a real-time signal. - Executive visibility
a) You’re trying to explain reliability posture with screenshots and technical jargon. * Business leaders don’t see a clear reliability dashboard; they see noise.
If you want to reduce monitoring tool sprawl without ripping everything out, you need a thin reliability layer that sits on top turning raw telemetry into a cohesive narrative.
Single Reliability View Readiness Checklist & Scorecard
What single pane of glass monitoring should actually deliver
A lot of vendors say “single pane of glass monitoring” and then deliver a web page full of disconnected widgets. That’s not helpful.
A modern unified observability platform should give you:
- End-to-end observability across apps, network and cloud
- Logs, metrics and traces in one place (or at least in one mental model)
- A centralized monitoring dashboard that makes it obvious what’s healthy, what’s degraded and what’s at risk
But the real differentiator is this: it shouldn’t just centralize data. It should centralize meaning.
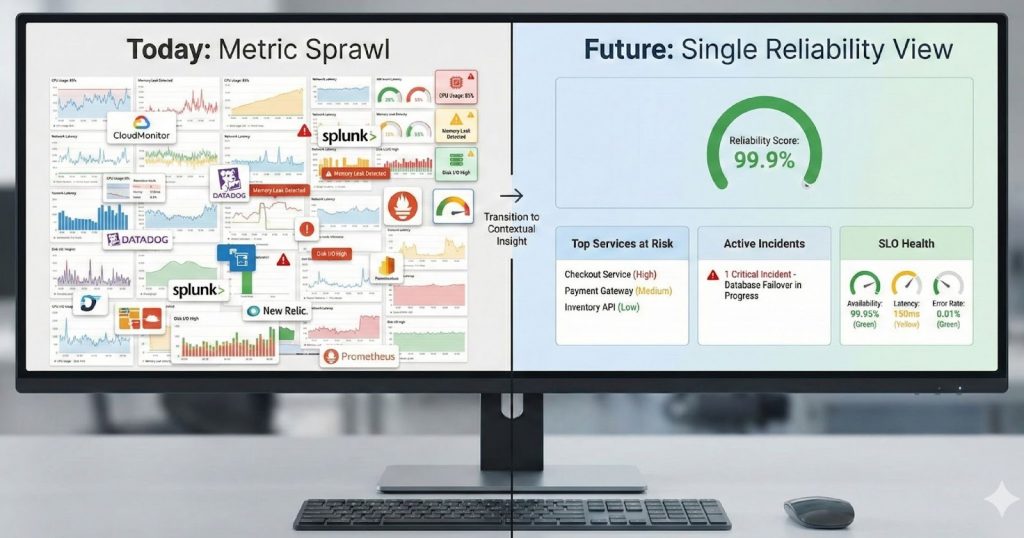
Metric sprawl vs single reliability view
Here’s the shift you’re aiming for:
| Today: Metric Sprawl with Many Tools | Future: Single Reliability View |
| Separate dashboards for every domain | One reliability-centric view across domains |
| Data organized by tool/vendor | Data organized by service and customer experience |
| Engineers decode charts for leaders | Plain-language insights anyone can read |
| Weak link to SLOs / SLIs / business | Built around service level objectives (SLOs) & service level indicators (SLIs) |
| MTTR tracked post-incident | Reliability risk forecasted before incidents happen |
In other words full-stack observability isn’t just “more metrics.” It’s a single reliability view for SRE teams and leadership where reliability, risk and ROI are visible on the same canvas.
This is where Scout-itAI takes a very different approach.
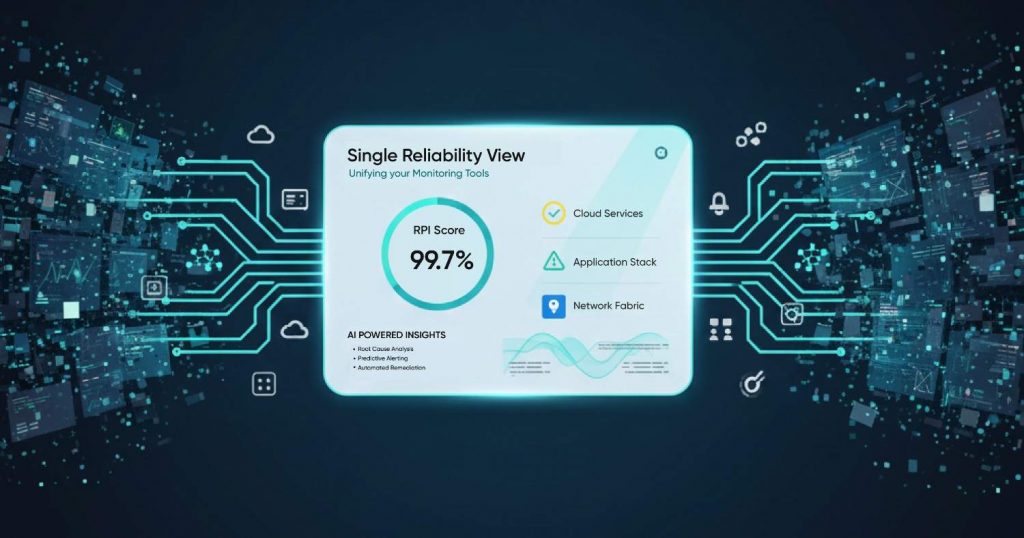
Instead of asking you to stare at thousands of time-series graphs, Scout-itAI uses its patented Reliability Path Index (RPI©) a 13-bucket scoring framework built on 15+ years of industry data to condense all of that complexity into one reliability score per service path.
Think of RPI as the backbone of your reliability dashboard:
- It pulls in telemetry across infrastructure, applications and networks
- It normalizes those signals into 13 reliability categories (RPI buckets)* It calculates a single score that reflects your reliability posture in real time
For SREs and IT leaders, this means:
- A single view of reliability regardless of mainframe, cloud apps or SD-WAN
- A way to align SRE reliability metrics (SLO burn, latency, packet loss) to business impact
- A language to use to create a reliability dashboard for leadership that doesn’t devolve into tech jargon
Instead of digging through tools to answer “How reliable is this business service today?” you have one score that everyone can understand and drill into when needed.
You can learn more about RPI on the RPI Index feature page and see how it fits into the rest of the platform.
How to unify monitoring tools without ripping and replacing
If you’re wondering how to unify monitoring tools practically, think in layers not tools.
- Where reliability data actually lives
List out your infrastructure monitoring tools, APM, log platforms and cloud monitoring tools (AWS, Azure, GCP, SaaS). Note what each is good at and which services matter most. - Define your reliability contract
Agree on:
a) Key service level objectives (SLOs) per service
b) The service level indicators (SLIs) that matter most
c) How you’ll track MTTR and uptime monitoring and error budget burn - Add a reliability-first AI layer
Instead of buying another point solution, add a platform like Scout-itAI that can:
a) Unify logs, metrics and traces in one dashboard, even if data stays in existing tools
b) Consume telemetry from your current stack and feed it into the the RPI and AI model.
c) Provide a centralized monitoring dashboard around services and customers, not tools
This is the best way to centralize monitoring data without starting from scratch. - Automate what humans shouldn’t do by hand
Let agentic AI:
a) Automatically cluster and de-duplicate alerts to reduce monitoring tool sprawl in your workflows
b) Suggest playbooks or fixes in natural language
c) Forecast SLO breaches before they impact customers - Tell the reliability story in business language
Use RPI and Scout-itAI’s AI to:
a) Publish a SRE team reliability view
b) Leadership reliability dashboard that explains what changed, why it matters and how you’re improving it over time
c) Now your observability and monitoring is a reliability program not just a bunch of tools.
Why this matters for CIOs, VPs and business stakeholders
For senior leaders this isn’t about packet loss; it’s about:
- Revenue protection – Avoiding high-impact outages in a world where downtime costs six figures an hour.
- Trust and reputation – Keeping digital experiences reliable for customers, partners and citizens.
- Clear accountability – Knowing if reliability is getting better, worse or plateauing across all services.
A single pane of glass monitoring strategy built on a single view of reliability means:
- IT and business can look at the same score and see the same story.
- You have a way to prioritize investments (“this change improves our RPI by 5 points and protects $X in revenue”).
- Boards and CEOs get ongoing visibility into how you’re making the business more reliable without tech jargon.
Conclusion
The goal of a single reliability view is better decisions: fewer, clearer alerts, faster AI-driven incident response, and measurable reliability improvements. Scout-itAI achieves this single view by combining RPI scoring, agentic AI, and hybrid cloud event intelligence, integrating with not replacing your current monitoring tools. Stop swiveling screens and start empowering your teams with a unified reliability layer. Try Scout-itAI on your existing stack or Book a Demo.
Frequently Asked Questions
Single pane of glass monitoring is where teams see the health of networks, applications and cloud environments through one interface. Instead of swiveling between multiple monitoring tools, you get end-to-end observability and a single monitoring dashboard that shows which business services are healthy, degraded or at risk.
The benefits include faster incident triage, lower MTTR, fewer blind spots and less alert fatigue. When you unify logs, metrics and traces in one place, engineers can see the full context of an issue quickly, leaders get a single view of reliability instead of fragmented reports.
The most practical way to unify monitoring tools is to add a layer that consumes data from your existing stack and organizes it around services and reliability. A platform like Scout-itAI can ingest telemetry from multiple monitoring tools, normalize it and present it via RPI scoring and AI insights giving you unified IT monitoring without a rip-and-replace project.
A single view of reliability is a single perspective on how reliably your critical services are being delivered to users, regardless of which domain (network, application or cloud) is at fault. It connects SRE reliability metrics, service level objectives (SLOs) and error budget monitoring into one reliability dashboard that both engineers and executives can understand.
Scout-itAI sits on top of your existing infrastructure monitoring tools, APM and cloud monitoring tools to act as a unified observability platform. It correlates telemetry into the RPI score, applies agentic AI for pattern detection and forecasting and delivers plain language insights that tell you what’s wrong, why it matters and how to fix it.
Unified observability reduces MTTR and improves uptime monitoring by giving teams a complete timeline and context for every incident. Instead of piecing together metrics from separate dashboards, engineers see the full chain network, application and user experience in one place. That shortens investigation time and makes it easier to prevent repeat issues.
In a single reliability view SLOs and SLIs are first-class citizens. SLIs (like latency, error rates and availability) feed into higher-level indicators like the RPI score, while SLOs define acceptable thresholds. When SLOs are at risk the platform can trigger alerts, guide incident response and update leadership on reliability posture in business terms.
Yes. Scout-itAI doesn’t require you to throw away your existing stack; instead it overlays your tools and becomes the primary place you go to understand reliability. Over time teams often find they can retire redundant dashboards because they trust the centralized monitoring dashboard and RPI-based insights as their single source of truth.
A leadership-oriented reliability dashboard focuses on trends, risk and outcomes overall RPI scores, SLO compliance, major incident counts and impact on customers or revenue. Engineers can still drill down into detailed telemetry but the top-level view uses simple language and clear visuals so non-technical stakeholders can see how reliability is improving over time.
The best way to centralize monitoring data is to adopt a unified observability vs multiple monitoring tools strategy. That means using a platform like Scout-itAI to ingest signals from on-prem, cloud and network domains; normalize them; and unify logs, metrics and traces in one dashboard. That gives you consistent reliability scoring and insights across every delivery path even in complex hybrid and multi-cloud environments.

Tony Davis
Director of Agentic Solutions & Compliance